$icon
[1] "house-door"

$color
[1] "primary"

$value
[1] 5000Ethiopia Malaria Indicator Survey
Overview
Row
$icon
[1] "clipboard2-pulse"

$color
[1] "info"

$value
[1] "18.7%"
$icon
[1] "thermometer-high"
$color
[1] "danger"
$value
[1] "19%"$icon
[1] "shield-check"
$color
[1] "success"
$value
[1] "54.3%"$icon
[1] "droplet-half"
$color
[1] "warning"
$value
[1] "32.5%"Row
Column
Column
Regional detail
Row
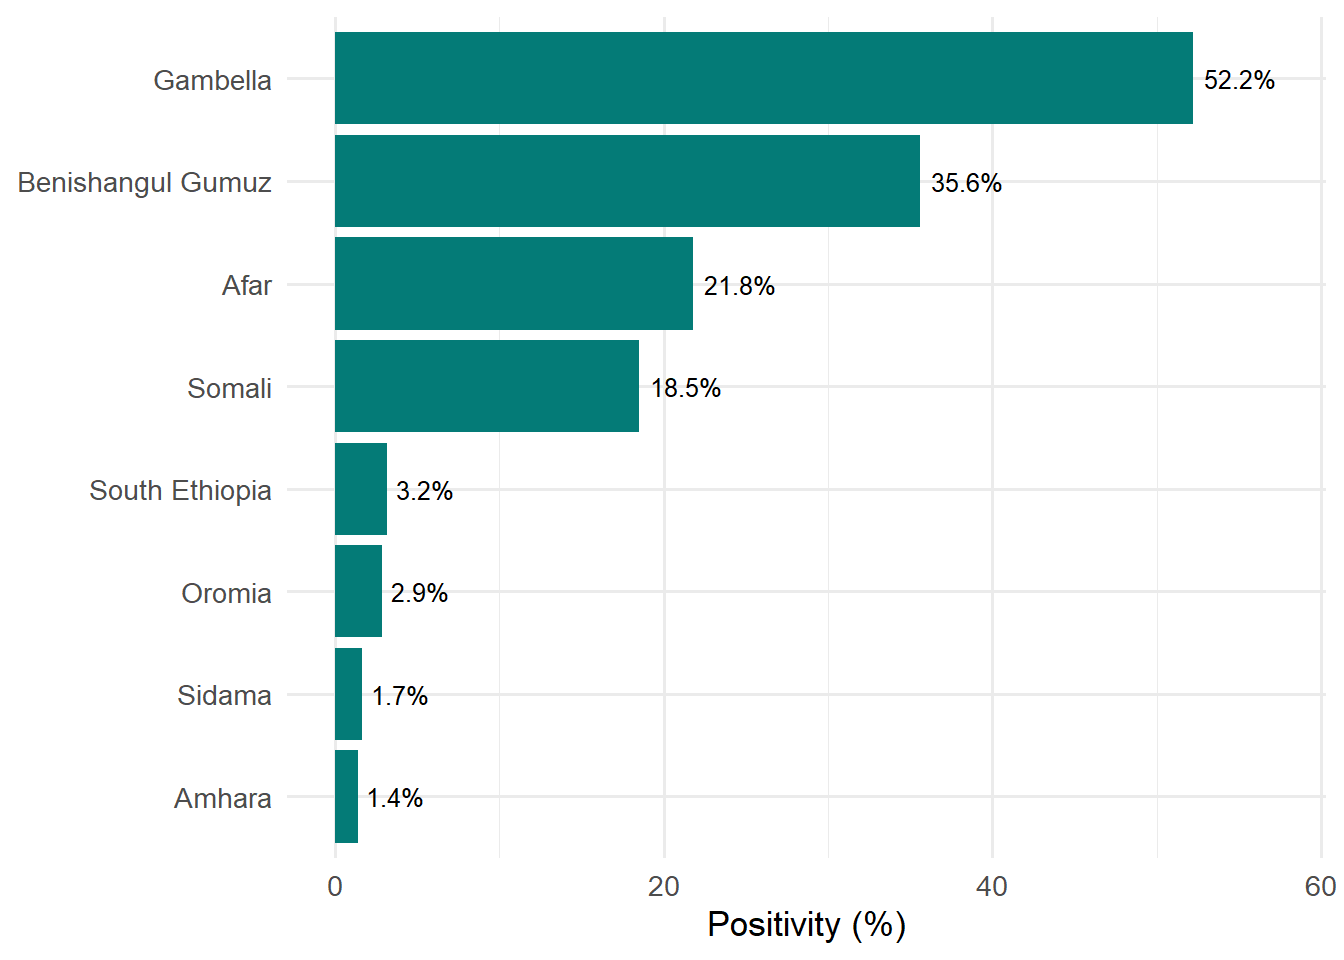
| Region | Tested (n) | Positivity (%) |
|---|---|---|
| Gambella | 686 | 52.2 |
| Benishangul Gumuz | 655 | 35.6 |
| Afar | 829 | 21.8 |
| Somali | 606 | 18.5 |
| South Ethiopia | 411 | 3.2 |
| Oromia | 842 | 2.9 |
| Sidama | 230 | 1.7 |
| Amhara | 655 | 1.4 |
Row
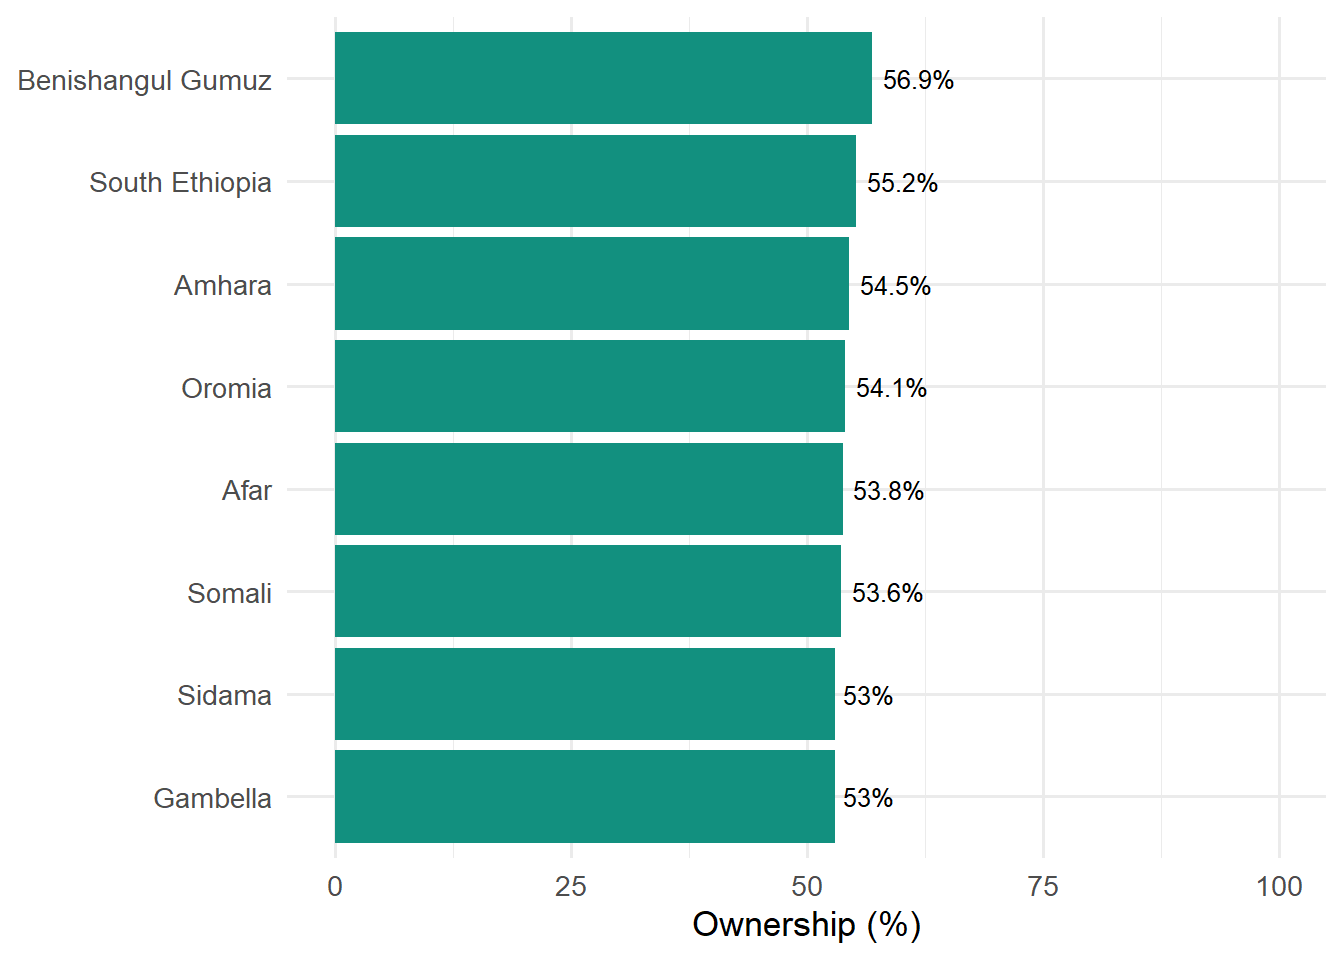
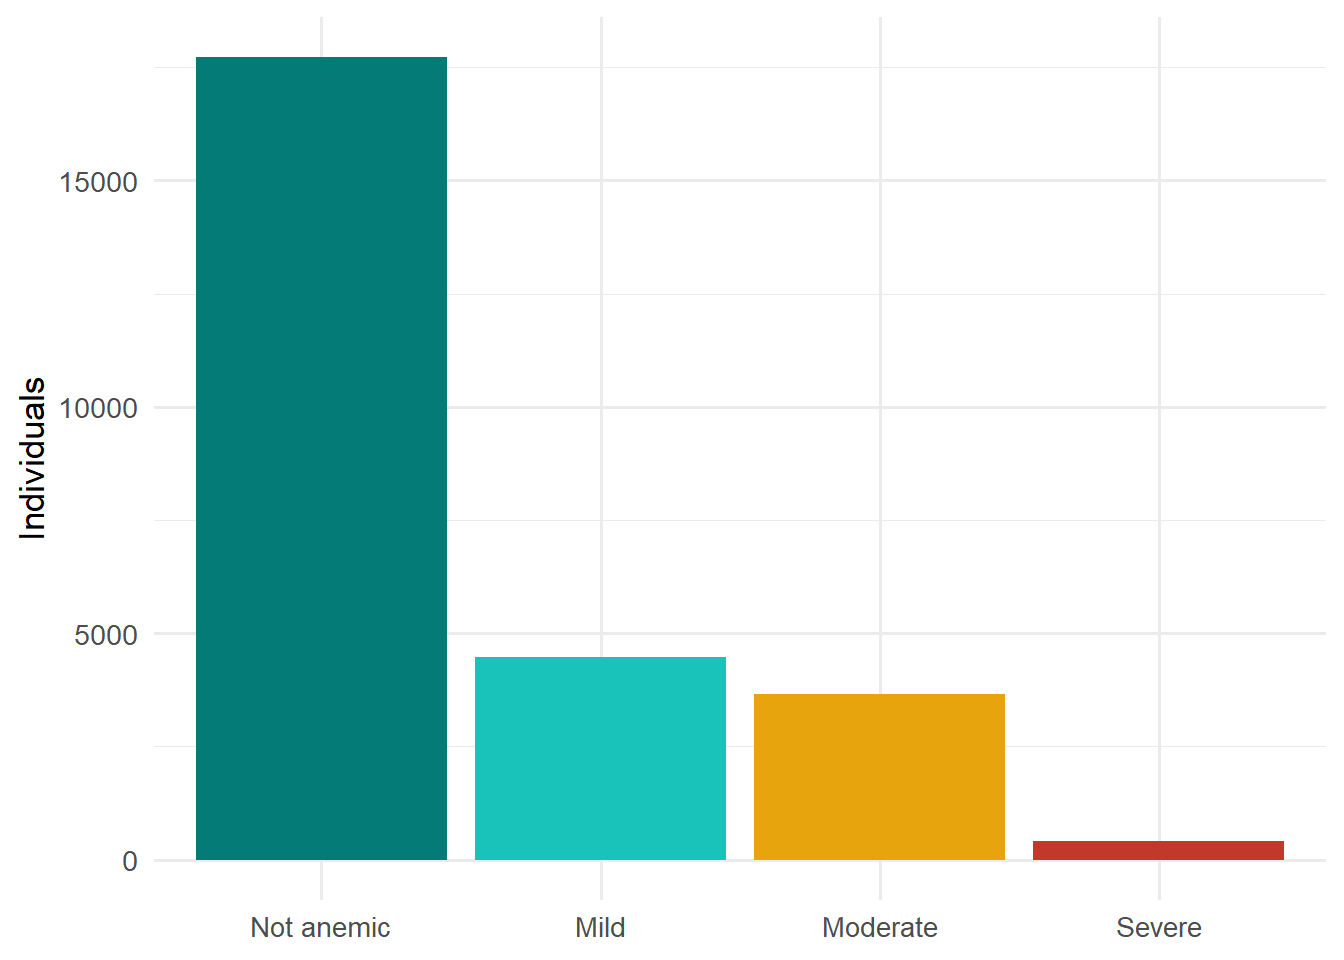
| Region | Bednet ownership (%) | Bednet use (%) | IRS coverage (%) | Any anemia (%) |
|---|---|---|---|---|
| Benishangul Gumuz | 56.9 | 41.6 | 51.2 | 35.7 |
| South Ethiopia | 55.2 | 40.7 | 24.7 | 31.5 |
| Amhara | 54.5 | 38.2 | 23.0 | 31.0 |
| Oromia | 54.1 | 38.7 | 25.2 | 32.2 |
| Afar | 53.8 | 38.6 | 32.8 | 32.3 |
| Somali | 53.6 | 38.4 | 30.4 | 32.5 |
| Gambella | 53.0 | 39.3 | 59.5 | 39.3 |
| Sidama | 53.0 | 37.4 | 16.4 | 30.5 |
Prevention & coverage
Row
$icon
[1] "shield-check"

$color
[1] "success"

$value
[1] "54.3%"
$icon
[1] "moon-stars"
$color
[1] "primary"
$value
[1] "39%"$icon
[1] "house-gear"
$color
[1] "info"
$value
[1] "29.7%"$icon
[1] "capsule"
$color
[1] "warning"
$value
[1] "83.4%"Row
Column
Column
Demographics & health
Row
Column
Column
Row
| Sex | Normal | Obese | Overweight | Underweight |
|---|---|---|---|---|
| Female | 63.9 | 0.8 | 15.4 | 19.9 |
| Male | 63.7 | 0.8 | 15.6 | 19.8 |